Get 1-on-1 MCAT Tutoring From a Specialist
With MCAT tutoring from MedSchoolCoach, we are committed to help you prepare, excel, and optimize your ideal score on the MCAT exam.
For each student we work with, we learn about their learning style, content knowledge, and goals. We match them with the most suitable tutor and conduct online sessions that make them feel as if they are in the classroom. Each session is recorded, plus with access to whiteboard notes. We focus on high-yield topics if you’re pressed for time. If you have more time or high-score goals, we meticulously cover the entire MCAT syllabus.
What Are Lineweaver Burk Plots?
Lineweaver Burk plots are another way of representing the data from Michaelis-Menten saturation curves. It originates from the Lineweaver Burk equation, which is derived from the Michaelis-Menten equation below:
V0 = (Vmax x [S]) / (KM + [S])
The reciprocal of this equation is:
1 / V0 = (KM / Vmax [S]) + (1 / Vmax)
From this, the Lineweaver Burk equation becomes:
1 / V0 = (KM / Vmax ) (1 / [S]) + (1 / Vmax)
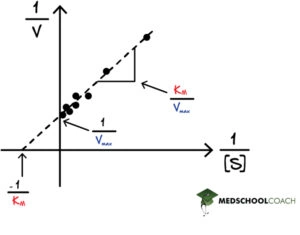
One thing to note about the Lineweaver-Burk equation is that when plotted as a graph, it is a linear line with the equation y = mx + b (see Figure 1). As a line, interpreting the data points is straightforward. The Michaelis-Menten saturation curve, on the other hand, is more challenging to interpret at times due to the different data points and the hyperbolic nature of the graph.

In Lineweaver Burk plots, the slope is equal to KM / Vmax, the x-intercept is equal to -1 / KM, and the y-intercept is equal to 1 / Vmax . The Lineweaver Burk plot is a graphical representation of enzyme kinetics. The x-axis is the reciprocal of the substrate concentration, or 1 / [S], and the y-axis is the reciprocal of the reaction velocity, or 1 / V. In this way, the Lineweaver Burk plot is often also called a double reciprocal plot. Increasing the substrate concentration decreases the value of 1 / [S] because the denominator is getting larger. Therefore, going left on the x-axis indicates an increasing substrate concentration. Likewise, a greater reaction velocity decreases the value of 1 / V. Therefore, going left and down the Lineweaver Burk plot indicates an increasing substrate concentration, which would naturally create a greater reaction velocity, since there is more substrate to react with the enzyme pushing the reaction forward.
One crucial point about the Lineweaver Burk plot is that the x-axis goes into negative values. However, there is no such thing as negative substrate concentrations. Instead, researchers can use this graph to extrapolate data from a hypothetical situation in which a negative substrate concentration exists.
Lineweaver Burk Plots and Enzyme Inhibition
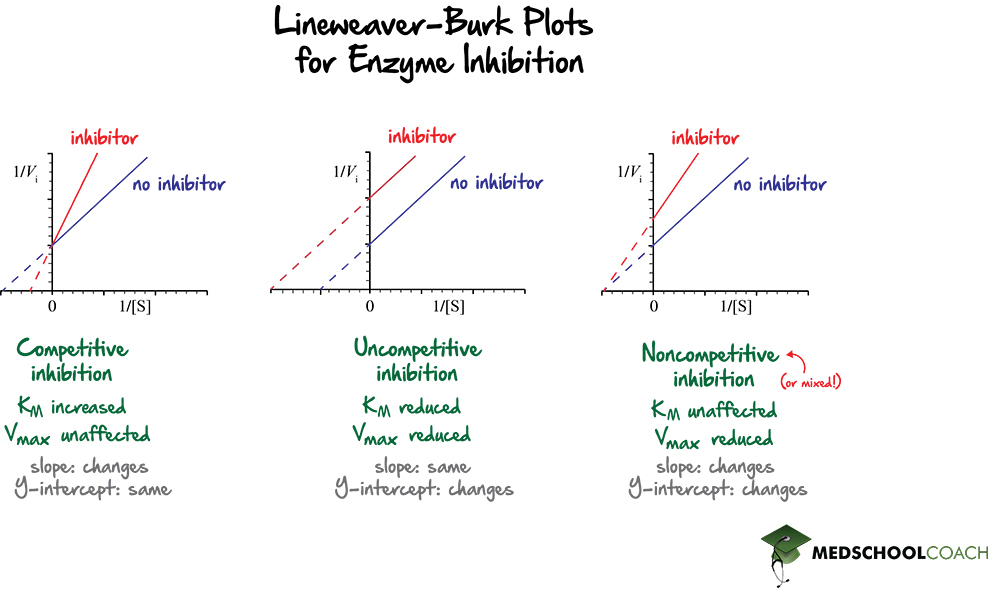
It is easy to visualize the effects of different types of enzyme inhibitors on an enzyme-catalyzed reaction using Lineweaver Burk plots. Figure 2 shows Lineweaver Burk plots with the effects of competitive, uncompetitive, and mixed inhibitors.

In terms of competitive inhibitors, recall that they compete directly with the substrate to bind to the active site of the enzyme. In turn, they will decrease the affinity of the enzyme for the substrate, which will increase the KM. As stated above, the x-intercept is equal to -1 / KM. Increasing the value of the KM will then decrease the value of the x-intercept. Decreasing the value of the x-intercept will shift the line closer to zero. Also, the y-intercept will stay the same because competitive inhibitors do not affect the maximum velocity of the reaction. In competitive inhibitors, the slope of the graph increases, the x-intercept shifts to the right, and the y-intercept is unchanged.
For uncompetitive inhibitors, both the KM and the Vmax will be reduced. Recall that since uncompetitive inhibitors increase the affinity of the enzyme for the substrate, KM decreases. Also, since the x-intercept is equal to -1 / KM, a smaller KM would give a larger value for the x-interceptor. In this way, the x-intercept will shift to the left. Also, since uncompetitive inhibitors also decrease the maximum reaction velocity, the value of the y-intercept, or 1 / Vmax , will increase. Increasing the y-intercept will shift the line upwards. Therefore, uncompetitive inhibitors will result in a parallel line to the original graph, in which both the x and y-intercepts have changed.
Lastly, for noncompetitive inhibitors, the KM is unaffected, and the Vmax decreases. Recall that noncompetitive inhibitors are a type of mixed inhibitors. As KM is unchanged, the x-intercept stays the same; however, since the Vmax decreases, the y-intercept shifts upward.


